Welcome to the page of my site dedicated to
seismology.
Through this page you can visualize the seismograms in
real time produced by my seismograph installed in the territory of the
Crotone country.
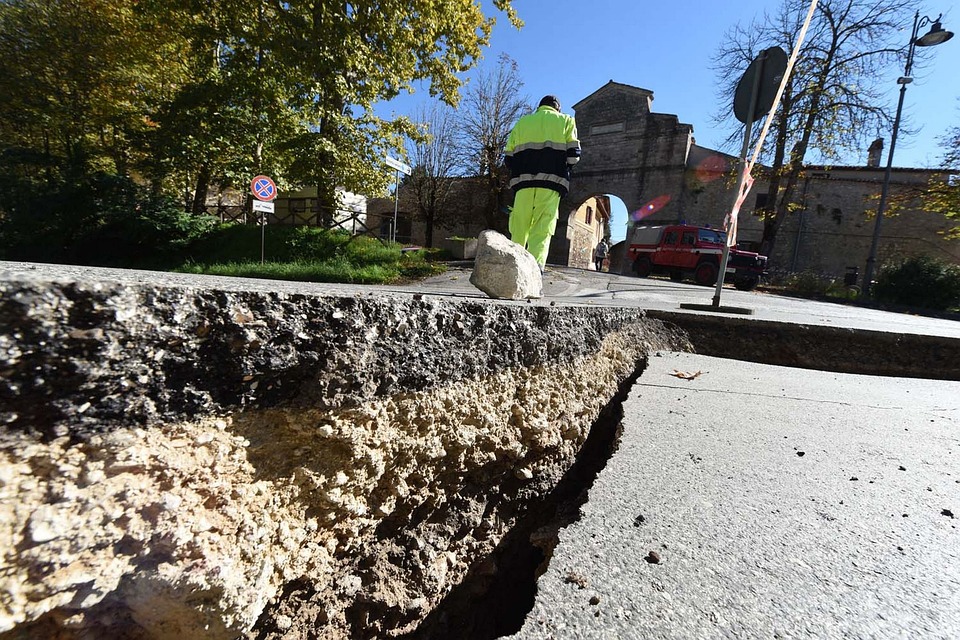
The choice to publish such a page is due to the
awareness of being born and living in a land where the seismic danger is
at the highest levels.
In fact, Italy is seismically active, but above all
Calabria, and in this specific case the marchesato crotonese
, is part of an area of conflict between the African plate and the
European plate, it is located on a small platform moving relative to the
south-east called "calabro
peloritano arc" which is bounded to the north by
the tectonic line of Sangineto and to the south by the tectonic line of
Taormina.
The
Marchesato crotonese, subjected for hundreds of thousands of
years to the pressure generated by the collision between the plates, is
currently rising, and is bordered by various seismic faults, in fact in
past times there have been destructive earthquakes including those of
June 1638 (6,9 of magnitude) and of March 1832 (6.6 of
magnitude). The territory was however affected by other destructive
seismic events that occurred in neighboring areas, such as the seismic
sequence of 1783, the seismic event of Martirano-Nicastro
of the
March 1638 (6.9 of magnitude), the Rossano earthquake of 1836 and
the earthquake of Reggio Calabria-Messina of 1908.
From here the compulsory choice to know as much as possible a sneaky
enemy, who can attack us at any time without warning and the decision to
equip itself with a continuous monitoring tool, in order to grasp the
possible precursor signals.
The self-constructed seismograph, consists of a pendulum with a weight
at the low end, it, with its micrometric movements generates an
electrical signal (through a
solenoid immersed in a magnetic field), which appropriately
amplified and filtered, is subsequently converted into
a digital signal through an
A / D converter and
processed by a software on a PC.
The software processes the digital signal, generates the
seismograms and publishes them on the site at the scheduled frequency.
Another form of monitoring is to process and display the
ULF (ultra low
frequency) and VLF (very
low frequency) signals amplified by an appropriate
receiver, also designed
and self-built, using a spectrum analyzer.
all
this in order to capture possible precursor signals, which manifest
themselves with disturbances and impulses, recognizable by an ear and an
expert eye.
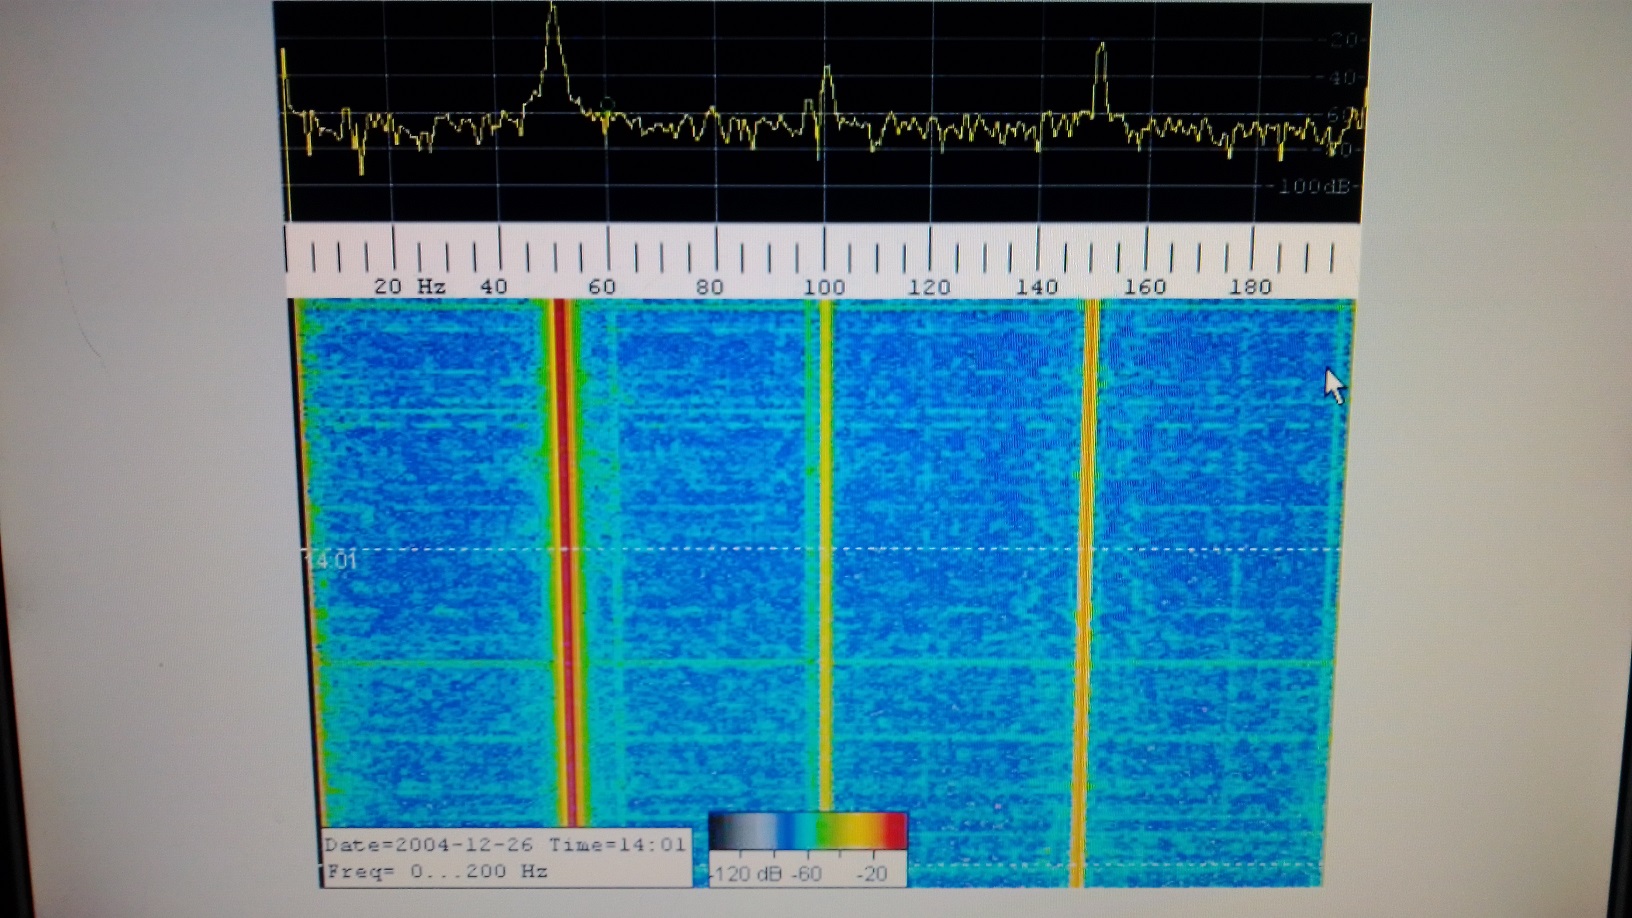
In the image below you can see a spectrogram taken from my
personal archive dating back to 2004 december 26,
that is the day of the disastrous earthquake
of Sumatra
(magnitude 9.3), you can see how the spectrogram is particularly
disturbed, a clear precursor or successor signal of a
strong and violent event, which can be caught in these cases even
at a great distance.
I
specify that the precursor signals, according to the various
documentation collected on the net, have never been lacking in the
Calabrian earthquakes, and can give a warning from a few minutes to a
few days before the seismic event occurs.
At the link that you will find two rows below
you can find an audio file with MP3 encoding lasting one minute, it is a
small example of what you can listen to in the
ULF-VLF band.
To listen the MP3 file click on this link.
What you
heard in the previous audio file shouldn't surprise you, because nature
emits a varied quantity of sounds in the ULF-VLF band, and every natural
event has its characteristic sounds, just use the right tools to capture
them. To provide proof of what has been said you can find two lines
below the link to an MP3 file that I recorded during the famous
snowstorm on Valentine's night 2021, on the following lines you will
find audio files recorded during violent storms, listen to the audio
files and you will be amazed.
To
listen to the Mp3 file relating to the sounds of the storm click on this
link.
To listen to the Mp3 file 1 relating to the sounds of the thunderstorm click on this link.
To listen to the Mp3 file
2
relating to the sounds of the thunderstorm click on this link.
This image represents the most recent state
of the virtual drum of my seismograph, the image can be enlarged by
touching it.
The date-time of the seismogram must be increased by 24 hours.
THE TEXTS,
AUDIO FILES AND IMAGES OF THE SEISMIC DRUM PRESENT ON THIS PAGE ARE
PERMITTED FOR READING, LISTENING AND VIEWING FOR EDUCATIONAL USE ONLY,
any other use is excluded and prohibited, they can be used on other
sites other than this one only with written authorization from me. The
material published on this page remains my exclusive property. The
published data has no legal value, they are obtained from home-built
equipment and could be affected by errors and inaccuracies. We decline
any responsibility for any use of what is published on this web page
that is not for educational use.
Informatics, Software and O.S., Computer network
Electronics, Active components, passive components
Radiowave
Seismo
Contacts
Who I am
Sitemap
Audio
Terms of use
Armando Caligiuri, Electronic senior expert, electronic and I.T. maintainer, I.T. consultant
Web master Armando Caligiuri
(C) 2024 V3.2